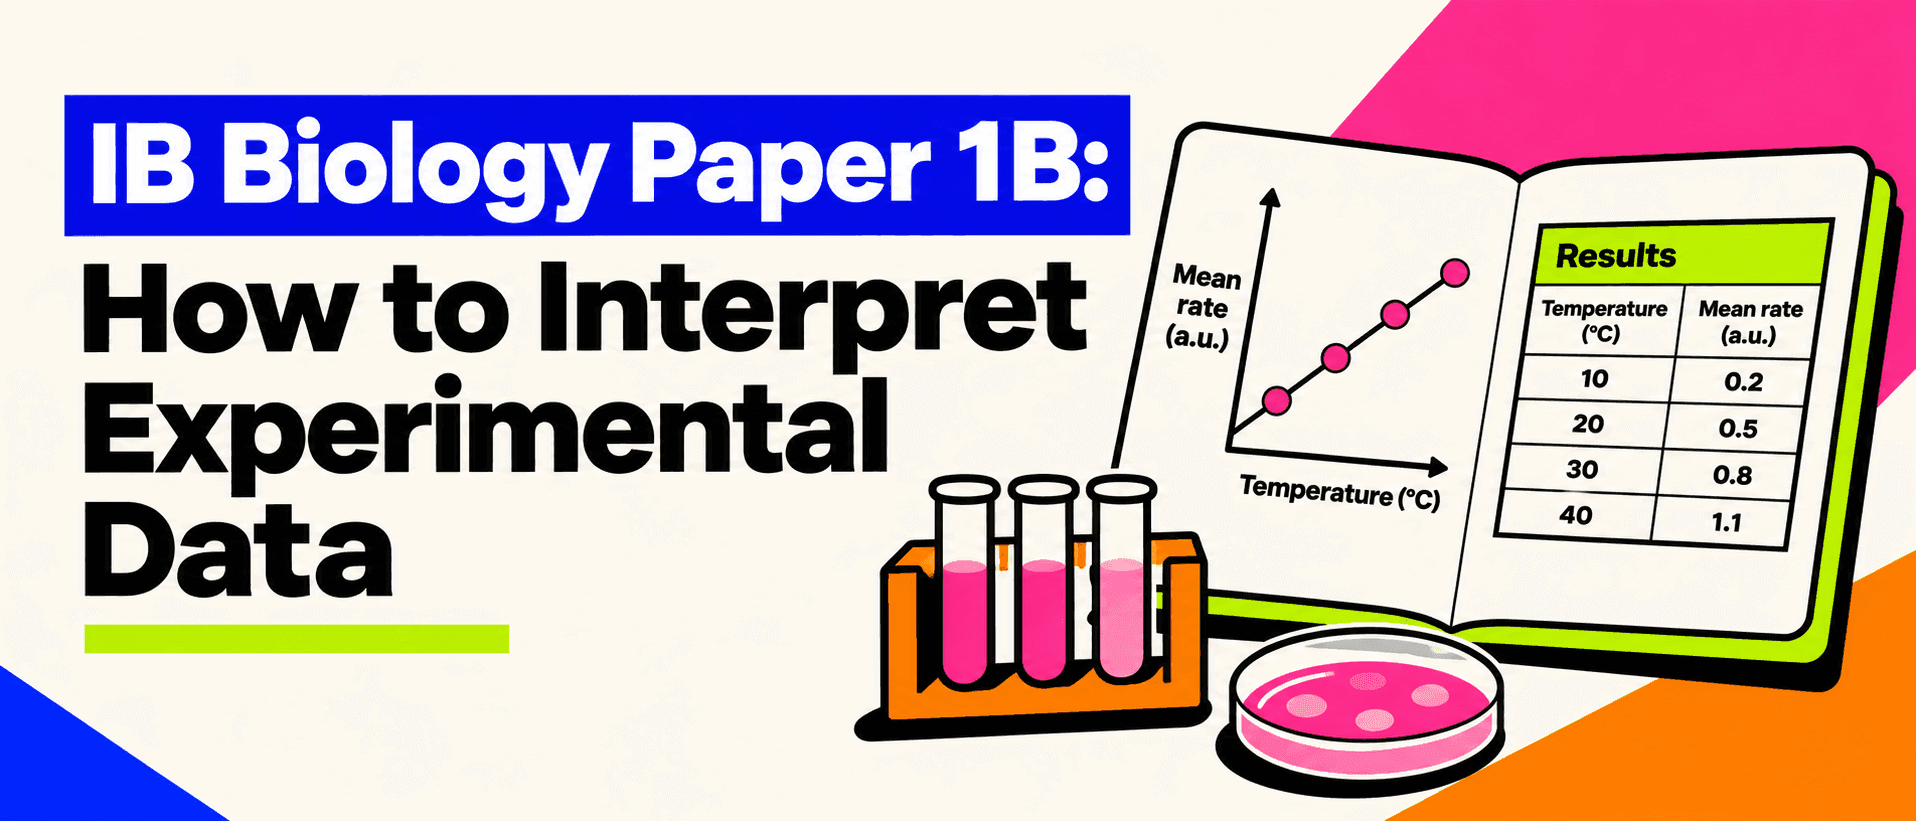
You revise enzymes, photosynthesis and ecology, then open Biology Paper 1B and find an unfamiliar experiment involving a species you have never studied. There is a graph, a table of measurements and a question asking whether the evidence supports a conclusion. Knowing the chapter does not immediately tell you what to write.
That difficulty appeared in the May 2026 Biology HL examination discussion, where students described Paper 1B's unfamiliar data as challenging. IB Biology Paper 1B rewards a different kind of preparation: reading investigations closely, recognising controlled comparisons, performing calculations and limiting conclusions to what results actually show.
This guide uses original, fictional datasets to teach those skills. The examples illustrate scientific reasoning and are not official IB questions.
What Does IB Biology Paper 1B Assess?
The current Biology course was first assessed in 2025. Paper 1A consists of multiple-choice questions; Paper 1B contains data-based questions drawing on syllabus-related contexts and scientific investigation. The IB Biology subject brief describes four data-based questions spanning the syllabus themes.
According to the official specimen papers, Paper 1B has 25 marks at SL and 35 at HL. Paper 1A and Paper 1B share a 90-minute session at SL or a 120-minute session at HL, with no separate fixed time allowance for each section. A calculator is required for Paper 1B.
The emphasis is not simply recalling a biological definition. You may need to identify a variable, interpret a plotted relationship, process data, assess uncertainty or explain why an experimental result does not fully establish a claim. The IB Biology curriculum explicitly emphasises evidence, scientific inquiry and the limitations of biological knowledge.
A Six-Step Method for Unfamiliar Investigations
1. Read the research aim. Identify what the investigators are trying to test before studying the numbers. Avoid guessing the conclusion from the topic alone.
2. Identify the independent and dependent variables. The independent variable is deliberately changed; the dependent variable is measured in response. Write down their units.
3. Locate the control and controlled variables. Identify what comparison isolates the intervention and what conditions must remain consistent. A control treatment is different from a controlled variable.
4. Inspect the table or axes. Note the scale, units, error bars, sample size and whether values are raw measurements or calculated means. Read the graph's actual values rather than its visual impression.
5. Describe the trend before explaining it. State what increases, decreases or levels off, using numerical evidence. Only then offer a biological mechanism if asked.
6. Check the strength of the conclusion. Ask whether replication, uncertainty, confounding variables or the observed range limit what can be inferred.
Worked Dataset 1: Nitrate and Algal Growth
Original practice investigation: A researcher grows the same freshwater algal species for five days under identical light and temperature conditions. Cultures begin at the same cell concentration. Different amounts of nitrate are added to otherwise identical growth medium, and cell concentration is measured at the end. Three independent cultures are tested per treatment.
All measurements below are invented for teaching, not experimental findings.
| Added nitrate (mg L⁻¹) | Culture 1 | Culture 2 | Culture 3 | Mean |
|---|---|---|---|---|
| 0 | 1.8 | 2.0 | 2.2 | 2.0 |
| 2 | 3.0 | 3.2 | 3.4 | 3.2 |
| 4 | 4.6 | 4.8 | 5.0 | 4.8 |
| 6 | 4.7 | 5.0 | 5.3 | 5.0 |
Cell concentrations are in units of 10⁴ cells mL⁻¹. The nitrate value is the concentration added, not a measurement proving that the medium contained no other nitrate.
Question 1: Identify the variables. Added nitrate concentration is the independent variable. Final algal cell concentration is the dependent variable. Light intensity, temperature, initial cell concentration, culture volume and incubation period should be controlled. The group with no added nitrate is the comparison treatment.
Question 2: Calculate the percentage increase from 0 to 4 mg L⁻¹. Use the means: [(4.8 − 2.0) ÷ 2.0] × 100 = 140%. The units cancel because this is a relative change. Be careful not to call the difference of 2.8 a percentage increase.
Question 3: Describe the pattern. Mean cell concentration increases from 2.0 to 4.8 × 10⁴ cells mL⁻¹ as added nitrate rises from 0 to 4 mg L⁻¹. It increases only slightly, to 5.0 × 10⁴ cells mL⁻¹, at 6 mg L⁻¹. This suggests a possible leveling off over the tested range.
Question 4: Evaluate the conclusion. The results support an association between added nitrate and higher final cell concentration under these conditions. They do not establish that 4 mg L⁻¹ is a universal optimum. There are only three replicates per condition, and the difference between the final two means is small relative to their variability. More concentrations and independent repetitions would help investigate a possible plateau.
How to Interpret Biology Graphs Precisely
Before writing about a graph, identify whether it shows a continuous variable, categories or repeated measurements over time. For the nitrate investigation, a scatterplot of treatment concentration against mean cell concentration is appropriate. The horizontal axis should read Added nitrate / mg L⁻¹ and the vertical axis Final cell concentration / 10⁴ cells mL⁻¹.
Do not infer a relationship from the steepness of a line before checking the numerical scales. A truncated vertical axis can make a small difference appear dramatic. Conversely, a wide axis range may visually flatten a meaningful change.
When comparing groups, cite at least two values. “Growth increased” is weaker than “the mean increased from 2.0 to 4.8 × 10⁴ cells mL⁻¹ between 0 and 4 mg L⁻¹ added nitrate.” If a graph includes error bars, identify what they represent rather than assuming every bar shows the same statistic.
Avoid extrapolating beyond the supplied range unless the question asks you to make and qualify a prediction. A model fitted between 0 and 6 mg L⁻¹ does not establish what happens at 20 mg L⁻¹.
Controls, Replicates and Confounding Variables
A control treatment provides a reference for comparison, such as the culture receiving no added nitrate. A controlled variable is something kept consistent across treatments, such as light duration. Confusing these is a common reason for vague answers.
Replication matters because individual biological samples vary. Three separate cultures offer information about repeatability that three readings from the same culture might not provide. But repeating measurements does not automatically remove systematic bias.
Suppose cultures with more nitrate also received more light because they were placed nearer a lamp. Light would be a confounding variable, making it difficult to attribute the observed difference to nitrate alone. Randomizing culture positions or keeping light conditions comparable would strengthen the design.
When asked to suggest an improvement, link it to a specific weakness and explain how it would improve validity or reliability. “Use better equipment” is usually too vague.
Worked Dataset 2: Distinguishing Variation From Significance
A second fictional investigation tests an enzyme at two temperatures, with four independently prepared samples at each temperature. Activity is recorded in arbitrary units per minute.
| Temperature | Sample activities | Mean | Sample standard deviation |
|---|---|---|---|
| 25 °C | 7, 8, 9, 8 | 8.0 | 0.82 |
| 35 °C | 8, 9, 10, 9 | 9.0 | 0.82 |
Question: Does the table prove that 35 °C produces greater enzyme activity? The sample mean is higher at 35 °C by 1.0 unit per minute, or 12.5% relative to the 25 °C mean. However, the samples show variation. Without a suitable statistical analysis and assumptions, the data alone do not establish a statistically significant difference or identify an overall optimum temperature.
Standard deviation describes variation among measurements, whereas standard error describes uncertainty in an estimated mean under specified sampling assumptions. A confidence interval expresses a range of plausible values for a parameter under its method's assumptions. Overlapping error bars alone are not a universal significance test. First identify what the bars actually show.
Write Conclusions That Match the Evidence
A good Paper 1B conclusion answers the question, quantifies the pattern and states its boundary. Distinguish three levels of claim:
Observation: “The mean activity was 9.0 at 35 °C and 8.0 at 25 °C.”
Interpretation: “The mean was higher at 35 °C in this sample.”
Overclaim: “35 °C is the enzyme's optimal temperature and always produces faster reactions.”
The last statement is unjustified because only two temperatures were tested. Equally, correlation between variables does not by itself establish causation. Read the study design before deciding which inference is reasonable.
Command Terms and Time Management
Paper 1B answers should fit the command term. Identify generally needs a precise name or selection. Calculate requires an appropriate operation, values and units. Describe reports patterns, while explain adds a defensible mechanism. Evaluate considers the strengths and limitations of the evidence, not just what went well.
Because Paper 1A and Paper 1B share a timed session, reserve sufficient time for data interpretation. Practise moving quickly through straightforward multiple-choice questions so unfamiliar graphs do not become rushed. If stuck, state a relevant trend or calculation and return later. The exact allocation between sections is a revision choice, not a separate IB-imposed time limit.
A Paper 1B Revision Checklist
Before your next practice session, check that you can:
- Identify independent, dependent and controlled variables.
- Distinguish a control treatment from an experimental treatment.
- Read axes, scales, units, legends and error bars accurately.
- Calculate means, percentage changes and simple rates when appropriate.
- Interpret replicates and uncertainty without claiming unsupported significance.
- Explain a pattern using relevant biology when the question asks why.
- Suggest a specific improvement tied to an identified limitation.
- Practise with official IB specimen papers and their markschemes.
Final Thoughts: Learn to Think From Data
The most transferable IB Biology Paper 1B skill is not memorizing the result of a familiar investigation. It is asking what was changed, what was measured, how reliable the comparison is and what conclusion follows.
Build that habit with unfamiliar tables and graphs. Practise calculations, but also practise saying what the evidence does not prove. When a new organism or technique appears in the exam, the underlying logic of experimental design will still be familiar.
Table of contents
Share
Related reading
- IB Biology HL vs SL: Choosing the Right Level in 2026Confused between IB Biology HL and SL? Discover key differences, workload, and scoring strategy to choose the right level and maximize your IB score.
- IB Economics HL Paper 3: Turn Data Into Accurate GraphsLearn IB Economics Paper 3 data interpretation with worked tables, calculations, accurate graphs and policy analysis. Practise with original examples today.
- IB English Paper 1: How to Analyse Unseen Text TypesMaster IB English Paper 1 text analysis with original examples of ads, articles, infographics and speeches, plus authorial-choice and timed essay strategies.
- IB Past Papers: How to Practise Without Wasting ThemStop wasting IB past papers. Learn how to ration fresh papers, self-mark with official markschemes, and practise under real exam conditions. Read the guide.
- IB DP Mock Exams: 5 Decisions Schools Must Make EarlyDesign stronger IB DP mock exams with a practical guide to timing, syllabus alignment, feedback, digital readiness and targeted student follow up. Read now.
- MYP eAssessment 30-Day Study PlanFollow this 30 day MYP eAssessment study plan with daily drills, timed practice, weekly checks and a printable planner. Start preparing smarter today.
- IB Grade Boundaries Explained: Study Smarter, Score HigherLearn how IB grade boundaries really work and build a smarter revision strategy to maximize your score. Read now and prepare with confidence.
- IB Study Schedule: How to Plan Your Revision (with Template)Create an IB study schedule that works with 1, 3 and 6 month revision plans, focused study blocks and a free template. Start planning smarter right now.